Following on my last post on product strategy/prioritization and pie charts… here’s another way to apply the same simple tools.
We make day-by-day or story-by-story prioritization choices without noticing the cumulative impact of those choices. But they add up. Seemingly small transactions can lean all in the same direction. For instance:
- Sales teams who each lobby the product team for one tiny customer-specific featurette
- Postponing work on improved automated test scripts (“just for this week”) while we finish urgent manual testing on a hot patch
- Pulling our one advanced researcher into a few design reviews for the core product
- Planning to visit the gym next Monday rather than today
All of these make sense in small quantities. (BTW, if you haven’t read Daniel Kahneman’s Thinking, Fast and Slow, you’re missing a brilliant view of decision-making.)
Try this experiment in the privacy of your office:
1. Look back at last quarter
Sort your completed user stories (or features or epics or work items) into these four buckets:
- Planned features. Customer visible improvements and new products that were on the immediate roadmap at the beginning of the quarter. Agile teams should include story/feature-level testing and whatever constitutes “DONE.”
- Unplanned features. Sales one-offs, unexpected customer commitments, executive additions and other work not on the roadmap at the beginning of the quarter.
- Quality and development infrastructure. Test automation, refactoring, emergency bug fixes, DevOps, training, and other work that isn’t directly visible to end customers. Waterfall teams should include QA/testing here.
- Validation, experiments and longer-term research. Discovery work to test out product concepts, research, and prototyping for things at least two quarters away. Figuring out how to solve hard problems for the future.
Sum up the story points “spent” (or whatever you have instead) in each bucket, rounded to the nearest 5-10%. If you’re not sure which bucket something goes into, quickly pick one that seems right. This is directional, not precise.
2. Draw it as a pie chart
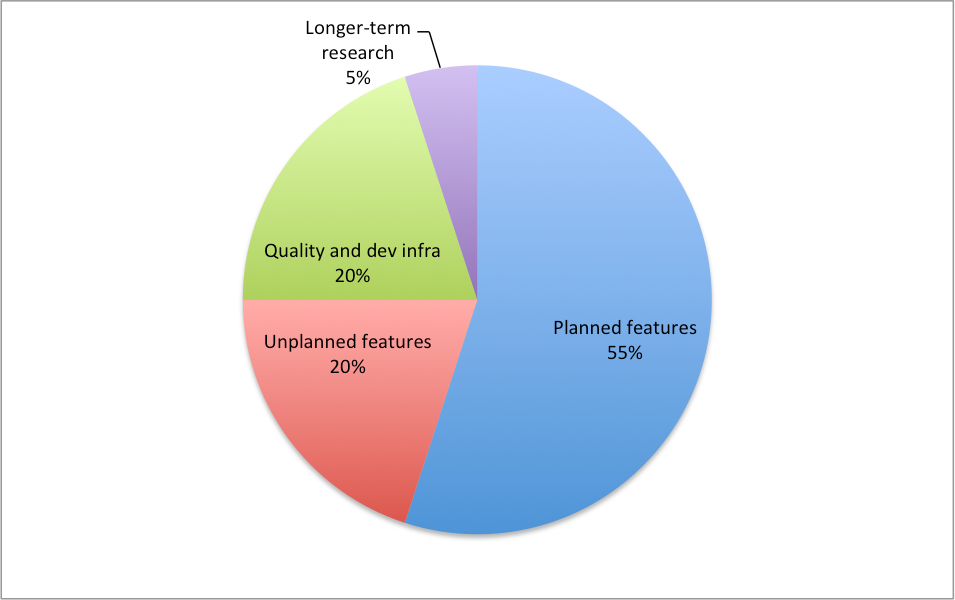
Execs and non-technical folks understand pie charts better than columns of numbers. You chart might look like something like this

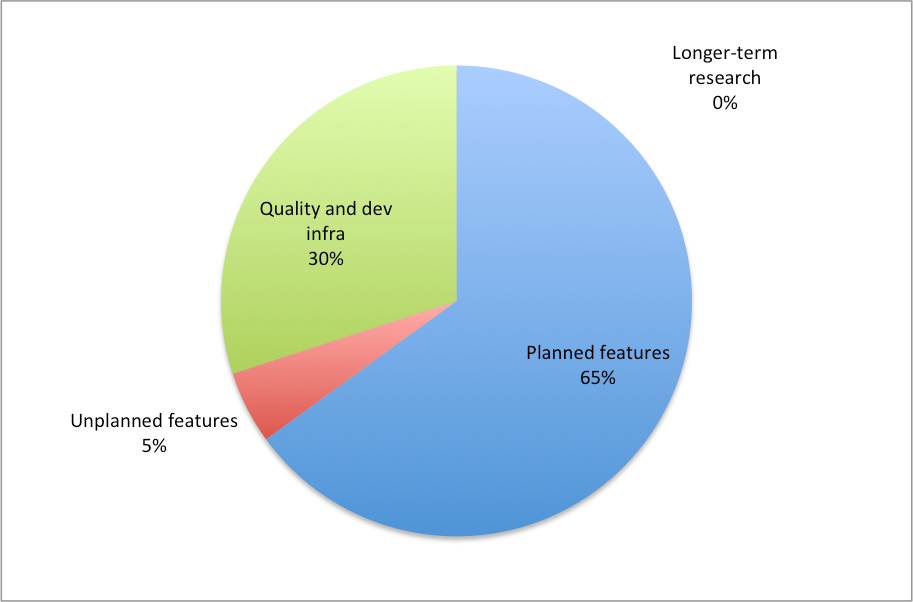
or this

3. Examine your implicit product budget
This is how you spent your immensely precious development budget. It’s your implicit product strategy: where recent choices have taken you. Are you surprised? What trade-offs or lifecycle stage does it suggest? How would your C-level executives react to this mix?
Notice that pie charts force us to look at proportions, not absolute numbers. As product managers or executives, we’re always looking to jam just one more thing into the development queue. But pie charts highlight (instead) relative spending by category. If you could make 5% between slices next quarter, what would you move?
Typical reactions or observations:
- “We keep talking about investing in quality, automated testing and agile, but keep pushing this back one quarter at a time as releases run late.”
- “Our sales team consistently captures 20-30% of the entire pie, which slips our major quarterly release. This might help our execs see how each little insertion adds up to real costs.”
- “We’re in a mature business, and not spending much on long-term R&D. But our strategic plan says that we should be growing 2-3 entirely new businesses for next year. Mismatch!”
- “We’re built on very old platforms, which costs a lot in terms of maintenance/ infrastructure/old tools to keep things working. We might invest heavily for one quarter to upgrade parts of the architecture, and then be able to shift resources back to features.”
4. Make this a regular practice
Consider allocating a budget at the beginning of the quarter and tagging each story with its category. Then look at completed quarter-to-date points before each sprint planning session. Product managers/ owners and the overall team can rebalance along the way to reduce drift.
At the end of each quarter, discuss whether the mix is right. Should you shift toward (or away from) additional features next quarter? Do you need more review of sales requests to keep them from overwhelming planned work? Has your Q1 over-investment in quality tools pair off enough to move resources elsewhere? This helps create product-level strategy, insulated from the latest disaster.
SOUND BYTE
Your overall product spending defines a strategy, even if unintentionally. Apply some simple tools, and see what you discover.

